

The MMXM Model, rooted in the Inner Circle Trader (ICT) methodology, is a powerful framework for understanding price movements in financial markets, particularly in forex, stocks, and cryptocurrencies. By focusing on Internal Range Liquidity (IRL) and External Range Liquidity (ERL), traders can predict market behavior with greater accuracy. This article breaks down these concepts, their interplay, and how to apply them across different timeframes to develop a daily trading bias. Whether you’re a beginner or an experienced trader, this guide will help you navigate the markets with confidence.
What is the MMXM Model?
The MMXM Model is a structured approach to market analysis that emphasizes liquidity and price imbalances. It revolves around two core concepts: Internal Range Liquidity (IRL) and External Range Liquidity (ERL). These concepts help traders identify where the market is likely to move next by understanding how price interacts with key levels of liquidity.
Key Idea: Price action in the markets does two primary things:
- Draws to old highs and lows (External Range Liquidity).
- Rebalances imbalances (Internal Range Liquidity).
By mastering these principles, traders can align their strategies with the market’s natural flow, increasing their chances of success.
Understanding Internal Range Liquidity (IRL)
What is IRL?
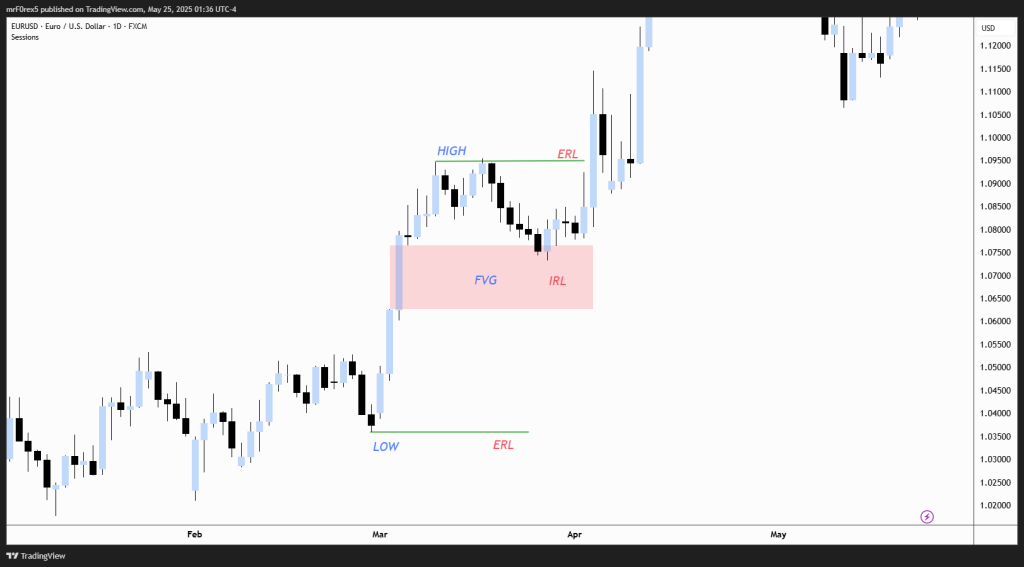
Internal Range Liquidity (IRL) refers to areas within a price range where liquidity imbalances exist. These imbalances are typically represented by Fair Value Gaps (FVGs), which occur when price moves rapidly, leaving a gap or inefficiency in the market. FVGs are areas where the market has not fully traded, creating a “void” that price often returns to fill.
How to Identify IRL?
- Fair Value Gaps (FVGs): On a candlestick chart, an FVG appears as a three-candle pattern where there is a gap between the wicks of the first and third candles, with the second candle’s body not overlapping. This gap represents an area of imbalance.
- Timeframes: FVGs can be identified on various timeframes (Monthly, Weekly, Daily, H4, H1), but higher timeframes carry more significance.
Example: If a Daily chart shows a bullish FVG (price gaps up without fully trading the range), the market may return to this area to rebalance the imbalance before continuing its trend.

Understanding External Range Liquidity (ERL)
What is ERL?
External Range Liquidity (ERL) refers to liquidity pools at the extremes of price ranges, typically represented by swing highs and swing lows. These are levels where stop-loss orders or pending orders accumulate, making them attractive targets for market makers.
How to Identify ERL?
- Swing Highs and Lows: These are the peaks and troughs on a price chart where the market reverses. They often represent areas where retail traders place stop-losses or breakout orders.
- Liquidity Grabs: When price breaks a previous high or low, it “takes” the liquidity at that level, often triggering stop-losses and clearing the way for the next move.
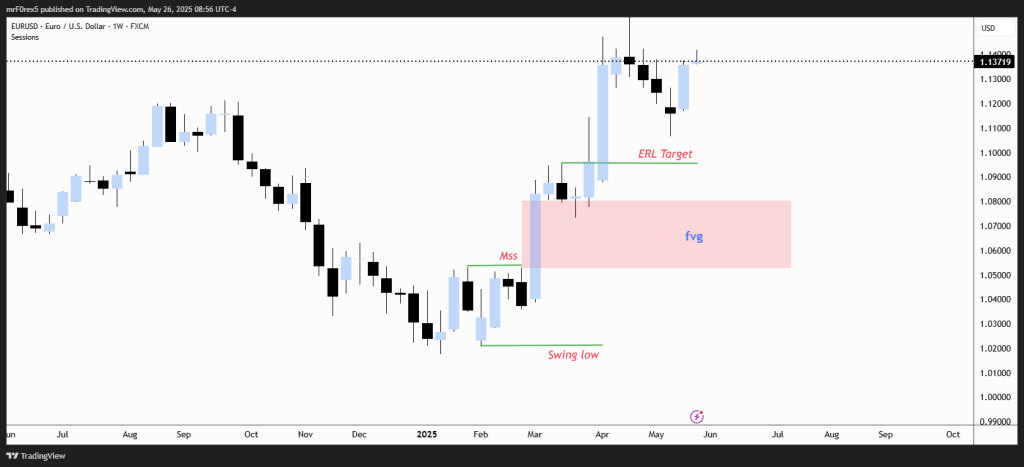
Example: If the market breaks a Weekly swing high, it has taken the ERL at that level. The next likely target could be an IRL (FVG) within the range.
The Interplay Between IRL and ERL
The MMXM Model emphasizes the dynamic relationship between IRL and ERL. Price movements often follow a predictable pattern:
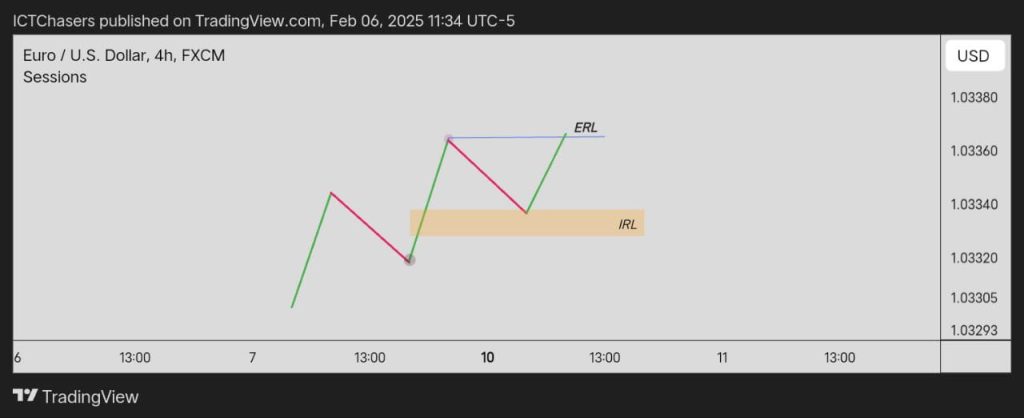
- ERL to IRL: When the market takes External Range Liquidity (e.g., breaks a swing high or low), it often moves toward an Internal Range Liquidity area (FVG) to rebalance the imbalance.
- IRL to ERL: After price tags or fills an FVG, it typically targets the next ERL, such as an old high or low.
This cycle creates a roadmap for traders to anticipate price movements.
Example:
- On a Daily chart, price breaks a swing low (ERL taken).
- The next target is a nearby FVG (IRL) on the Daily chart.
- After filling the FVG, price may reverse and target a previous swing high (ERL).
Timeframe Alignment: The Key to Daily Bias
To effectively use the MMXM Model, traders must align their analysis across multiple timeframes. Higher timeframes provide the overall market context, while lower timeframes offer precision for entries and exits.
Timeframe Hierarchy
- Monthly IRL & ERL > Daily Structure: Monthly highs, lows, and FVGs set the broader market direction. Daily charts refine this structure.
- Weekly IRL & ERL > H4 Structure: Weekly levels guide H4 price action, providing intermediate targets.
- Daily IRL & ERL > H1 Structure: Daily levels inform H1 entries, allowing traders to fine-tune their trades.
How to Align Timeframes
- Start with Higher Timeframes: Identify Monthly and Weekly ERL (highs/lows) and IRL (FVGs). These levels act as major magnets for price.
- Drill Down to Lower Timeframes: Use Daily and H4 charts to find precise entry points within the context of higher timeframe levels.
- Confirm with H1 Structure: The 1-hour chart helps time entries when price approaches IRL or ERL levels.
Example:
- Monthly Chart: A swing low (ERL) is taken, and a bearish FVG (IRL) is identified.
- Weekly Chart: Price moves toward the FVG, confirming the Monthly bias.
- Daily Chart: A smaller FVG or swing high/low provides an entry opportunity.
- H1 Chart: Price action confirms the entry with a liquidity grab or FVG fill.
Practical Application: Building a Daily Trading Bias
To develop a daily trading bias using the MMXM Model, follow these steps:
- Analyze Higher Timeframes:
- Check Monthly and Weekly charts for significant ERL (highs/lows) and IRL (FVGs).
- Note whether ERL has been taken and if price is moving toward an IRL.
- Refine with Daily and H4 Charts:
- Identify Daily ERL and IRL levels.
- Confirm if the market is targeting an FVG or a swing high/low.
- Execute on H1:
- Use the 1-hour chart to time entries when price approaches key levels.
- Look for confirmation signals like liquidity grabs or candlestick patterns.
- Monitor Price Action:
- Price will either draw to old highs/lows (ERL) or rebalance FVGs (IRL).
- Be prepared for reversals or continuations based on the MMXM cycle.
Example:
- Monthly: Price takes a swing high (ERL) and moves toward a bearish FVG (IRL).
- Weekly: The FVG is partially filled, and price targets a Daily swing low (ERL).
- Daily: A bullish FVG forms, suggesting a potential reversal.
- H1: Enter a long position when price retests the Daily FVG with bullish confirmation.
Why the MMXM Model Works
The MMXM Model is effective because it aligns with how institutional traders and market makers operate. By targeting liquidity pools (ERL) and rebalancing inefficiencies (IRL), the market follows a logical path. Traders who understand this cycle can position themselves ahead of major price moves, avoiding traps set by retail-driven momentum.
Benefits of the MMXM Model
- Clear Structure: Provides a systematic approach to market analysis.
- Multi-Timeframe Alignment: Ensures trades are backed by higher timeframe context.
- Predictable Patterns: The ERL-to-IRL cycle offers repeatable setups.
- Versatility: Applicable to forex, stocks, cryptocurrencies, and more.
Tips for Success
- Practice Chart Analysis: Spend time identifying FVGs and swing highs/lows on different timeframes.
- Backtest the Model: Test the ERL-to-IRL cycle on historical data to build confidence.
- Use Risk Management: Always define your risk before entering a trade, as liquidity grabs can be volatile.
- Stay Patient: Wait for price to confirm your bias on lower timeframes before acting.
Conclusion
The MMXM Model, with its focus on Internal Range Liquidity (IRL) and External Range Liquidity (ERL), is a game-changer for traders seeking to understand market dynamics. By aligning Monthly, Weekly, Daily, and H1 timeframes, you can develop a robust daily trading bias that anticipates price movements with precision. Whether you’re trading forex, stocks, or cryptocurrencies, mastering the ERL-to-IRL cycle will unlock new opportunities and improve your trading outcomes.
Start applying the MMXM Model today by analyzing your charts, identifying key liquidity levels, and practicing disciplined trade execution. With time and experience, this approach can become the key to your trading success.
Call to Action: Share your experiences with the MMXM Model in the comments below, and join our trading community for more insights and strategies!


17 thoughts on “Understanding the MMXM Model : IRL to ERL in Trading ICT”
Thank you very much Sir
MMXM –
IRL – ERL
ERL – IRL
1D – bias
1h – structure
5m – entry = 🏧✅
Kese thora smjhaein gy ?
MASHALLAH ZARBARDAST
Thank you
Brilliant
Do you have YouTube channel
Nice article,
Perfectly explained now I can excute my trades with confidence….
Thank you dear Charles Cheelo
Nice
Thank you
Masha Allah
Have learnt them now let me take action to master them thanks bro
what time frames need to be analyzed if trading is supposed to be taken in 1 min?
what about for 5 min?
All very good but it would also be ice to know what MMXM actually means. ICT stuff is full of unexplai ed across yes.
All very good but it would also be ice to know what MMXM actually means. ICT stuff is full of unexplai ed across yes.
Thanks sir can interpret IRL, ERL, and MMXM
So perfect, so confident, so trusting!! Thank you so much. I’m grateful. Working on this to improve myself